1. What is the python code for this problem:
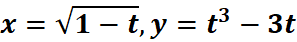
# 1st: Import the sympy module
import sympy as sp  # Import SymPy for symbolic mathematics

# 2nd: Define the parameter t
t = sp.symbols('t')  # Define 't' as a symbolic parameter

# 3rd: Define the parametric equations
x = sp.sqrt(1 - t)  # Define x = sqrt(1 - t)
y = t**3 - 3*t  # Define y = t^3 - 3*t

# 4th: Differentiate x and y with respect to t
dx_dt = sp.diff(x, t)  # Compute dx/dt
dy_dt = sp.diff(y, t)  # Compute dy/dt

# 5th: Compute dy/dx using the chain rule (dy/dx = (dy/dt) / (dx/dt))
dy_dx = sp.simplify(dy_dt / dx_dt)  # Simplify the expression for dy/dx

# 6th: Display the results using pretty printing
print("dx/dt:")
sp.pprint(dx_dt, use_unicode=True)  # Pretty print dx/dt

print("\ndy/dt:")
sp.pprint(dy_dt, use_unicode=True)  # Pretty print dy/dt

print("\ndy/dx:")
sp.pprint(dy_dx, use_unicode=True)  # Pretty print dy/dx
2. What is the python code for this problem:
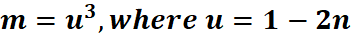
# 1st: Import the sympy module
import sympy as sp  # Import SymPy for symbolic mathematics

# 2nd: Define the symbolic variable
n = sp.symbols('n')  # Define 'n' as a symbolic variable

# 3rd: Define u in terms of n
u = 1 - 2 * n  # Define u = 1 - 2n

# 4th: Define m in terms of u
m = u**3  # Express m using u directly as m = (1 - 2n)³

# 5th: Differentiate m with respect to n
dm_dn = sp.diff(m, n)  # Compute the derivative of m with respect to n

# 6th: Display the result using pretty printing
print("The derivative dm/dn is:")
sp.pprint(dm_dn, use_unicode=True)  # Pretty print the derivative
3. What is the python code for this problem:
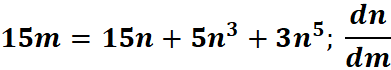
# 1st: Import the sympy module
import sympy as sp  # Import SymPy for symbolic mathematics

# 2nd: Define the symbolic variables
m, n = sp.symbols('m n')  # Define 'm' and 'n' as symbolic variables

# 3rd: Define the implicit equation
equation = 15 * m - (15 * n + 5 * n**3 + 3 * n**5)  # Given implicit equation

# 4th: Treat n as a function of m
n_func = sp.Function('n')(m)  # Define n as a function of m

# 5th: Substitute n with n(m) in the equation
equation_sub = equation.subs(n, n_func)

# 6th: Differentiate both sides with respect to m
diff_eq = sp.diff(equation_sub, m)

# 7th: Solve for dn/dm (n'(m))
dn_dm = sp.Derivative(n_func, m)  # Define dn/dm
solution = sp.solve(diff_eq, dn_dm)  # Solve for dn/dm

# 8th: Display the result using pretty printing
print("The derivative dn/dm is:")
sp.pprint(solution[0] if solution else "No solution found.", use_unicode=True)
4. What is the python code for this problem:
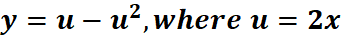
# 1st: Import the sympy module
import sympy as sp  # Import sympy for symbolic mathematics

# 2nd: Define the variables
x, u = sp.symbols('x u')  # Define 'x' and 'u' as symbolic variables

# 3rd: Define the function y in terms of u
y = u - u**2  # Define y = u - u²

# 4th: Express u in terms of x
u_expr = 2 * x  # Given u = 2x

# 5th: Substitute u in y
y_expr = y.subs(u, u_expr)  # Replace u with 2x in y

# 6th: Differentiate y with respect to x
dy_dx = sp.diff(y_expr, x)  # Compute dy/dx

# 7th: Display the result using pretty printing
print("The derivative dy/dx is:")
sp.pprint(dy_dx, use_unicode=True)  # Output the simplified derivative
5. What is the python code for this problem:
# 1st: Import the necessary modules
import numpy as np  # Import numpy for numerical operations
import matplotlib.pyplot as plt  # Import matplotlib for plotting

# 2nd: Define the parameter t
t = np.linspace(-5, 5, 300)  # Generate 300 points for a smoother curve

# 3rd: Define the parametric equations
n = t - 1  # Define n = t - 1
y = t**2 + 1  # Define y = t^2 + 1

# 4th: Create and customize the plot
plt.figure(figsize=(8, 6), dpi=100)  # Create a high-quality figure
plt.plot(n, y, label=r'$\mathbf{n = t - 1, \quad y = t^2 + 1}$', color='b', linewidth=2)  # Plot with label & thickness

# 5th: Enhance plot with labels, title, and grid
plt.title('Parametric Curve: $n = t - 1, \quad y = t^2 + 1$', fontsize=14, fontweight='bold')  # Add title
plt.xlabel(r'$\mathbf{n (t - 1)}$', fontsize=12)  # X-axis label
plt.ylabel(r'$\mathbf{y (t^2 + 1)}$', fontsize=12)  # Y-axis label
plt.axhline(0, color='black', linewidth=1, linestyle='--')  # Add x-axis reference line
plt.axvline(0, color='black', linewidth=1, linestyle='--')  # Add y-axis reference line
plt.grid(color='gray', linestyle='--', linewidth=0.5, alpha=0.7)  # Add grid with transparency
plt.legend(fontsize=12, loc='upper left')  # Display the legend
plt.show()  # Show the final plot